

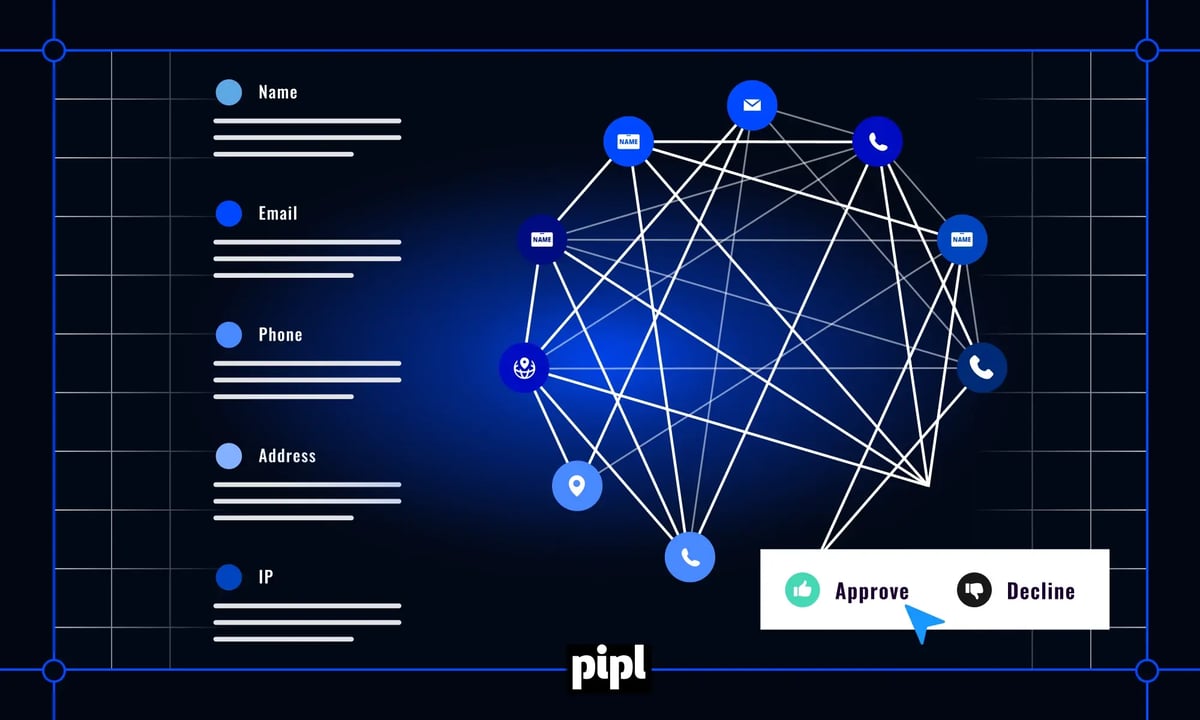


Every minute an analyst spends on a flagged case is a minute of labor you pay for. At an illustrative loaded cost of $40 an hour, a manual fraud review that takes 5 to 10 minutes costs roughly $3 to $7 in analyst time alone, before you count the good customer waiting on the other side of the decision. Review still earns its place: in the Merchant Risk Council’s 2025 Global eCommerce Payments and Fraud Report, based on a survey of 1,082 merchant professionals, 98% of merchants reported experiencing at least 1 type of fraud in the previous 12 months. The real question is how fast and how consistently your analysts can decide.
When a case lands in the queue, an analyst needs the identity story: how old the email is, how many other names use it, whether the phone is a real mobile line or a VoIP number, where the IP sits, and whether billing and shipping line up. Trust Insights, the analyst-facing part of Pipl Trust, answers those questions on a single page, showing identity connections, trust signals, and risk indicators at a glance.
What is manual fraud review?
Manual fraud review is the step where a trained analyst examines a transaction, signup, or account change that an automated system flagged as uncertain, then decides whether to approve it, decline it, or escalate it. It exists for cases where a score alone isn’t enough, and its quality depends on how much identity context the analyst can see.
Most queues fill from the same source: a rules engine or risk model returns a score in the gray zone between a clear approval and a clear decline. Those borderline cases are expensive in both directions. Approve a fraudster and you absorb a chargeback; decline a real customer and you lose the sale, and often the customer with it. Every case in the fraud review queue is a judgment call made under time pressure.
Why is manual fraud review so slow?
Review is slow because most tools show each identity element in isolation, leaving the analyst to assemble the connections by hand. A typical case view lists an email, a phone number, billing and shipping addresses, and an IP location, perhaps with a score and a few flags. What it rarely shows is context: that the email first appeared 3 days ago, that it has been paired with 5 other names, that the phone is disposable, or that 3 declined orders this month used the same billing address.
To find that out, analysts copy identifiers into other tools, switch tabs, and cross-reference by hand. The detective work costs time and introduces error. Analysts juggling many windows miss connections. Faced with incomplete information, many default to “when in doubt, decline,” which quietly turns uncertainty into false declines. Two analysts can reach different decisions on near-identical cases simply because one of them noticed a detail buried in the twelfth tab. The same problem shows up upstream, where fraud alert fatigue sets in once signals arrive without enough context to act on.
What should an analyst check in a manual fraud review?
An analyst should check whether each identity element is real, how long it has existed, and whether the elements connect to each other in the real world. A practical checklist:
- Email: Is the format valid, and is the domain commercial, personal, or disposable? How long has the address existed, how many identities has it been paired with, and has it appeared in a data breach?
- Phone: Is it a valid number, and is it mobile, landline, or VoIP? Is it disposable, and how long has it been in use?
- Address: Is it a valid residential address, or a mail forwarder or shipping store? Has it been stable over time, and has it appeared in recently declined transactions?
- IP: Is it residential, corporate, or a datacenter, and is it a proxy or VPN? Does its country match the rest of the story?
- Connections: Do the email, phone, name, and address belong to the same person? Have they belonged together for a while?
The last question matters most. A real customer’s identity elements form a coherent history, while a synthetic identity presents clean attributes with no past behind them. The Federal Reserve’s industry-recommended definition of synthetic identity fraud, published in 2021, describes it as combining pieces of personal information to fabricate a person or entity for financial gain. That fabrication is exactly what a connected view exposes.
How Trust Insights brings manual fraud review onto a single screen
Trust Insights replaces scattered tabs with a single view built around 3 elements: a connection graph, a signal summary, and a case scorecard.
The connection graph plots every identity element in the case, including email, phone, name, addresses, and IP, as nodes, with edges showing how they relate. Strong connections, such as an email and phone that resolve to the same person in Pipl’s identity graph of 5B+ identities, are visually distinct from weak or suspicious ones, such as an email paired with an unusual number of names. Unverified links are marked as unverified.
Alongside the graph, the signal summary shows the trust and risk indicators for each element on the checklist above: email age and volatility, phone line type, address validity, IP type, and more. Below them, the scorecard shows the Trust Score on its 0–1,000 scale, a risk level, and the flags that stand out, with the riskiest elements highlighted so analysts don’t have to hunt for problems.
The score isn’t a verdict. Elephant, Pipl’s large risk model (LRM), evaluates 1,000+ signals in combination and retains the reasoning behind each score. Trust Insights surfaces that reasoning to the analyst, which is what lets a reviewer confirm or overrule a score with confidence. Your team keeps the decision while Pipl supplies the evidence.
How connection graphs expose fraud rings
A connection graph turns a single suspicious case into a visible pattern. Picture an analyst opening a signup with a questionable email. The graph shows that email connected to 12 other identities, each with a different name, each created in the past week, each using a phone number from the same VoIP provider. Clicking into a connected identity reveals the same shape again. What would take hours of manual cross-referencing becomes obvious in a minute: this is a coordinated ring, not a lone bad actor.
Clicking any node opens its full profile, including the names it has been paired with, associated emails and addresses, and the IPs it has used. A genuine person’s connections tell a consistent story that builds over years. A synthetic identity’s connections are recent, sparse, and unrelated to each other.
Trust Insights also flags identity elements shared across your queue. If the email in today’s review appeared in a case declined yesterday, the analyst sees it immediately. A single fraudulent email is a data point; 5 cases in the decline queue sharing it is a pattern worth acting on.
Data cards, maps, and tables: detail without switching tabs
Hovering over a node opens a data card with the detail an analyst needs to confirm a hunch. For an email, that includes associated names, phones, and addresses, breach exposure and when it occurred, when the address was last seen and with which name, and how often it has appeared over the past year. Linked online profiles help separate real people from fakes, since a long-lived, active footprint is a strong sign of a real person, while a synthetic identity typically has no footprint or only brand-new accounts. Address cards show whether a location is residential or a known reshipping point, whether it’s new or historically stable, and whether it has appeared in recent declines.
For cases with geographic mismatches, a map view plots every address and IP location together. A New York customer shipping a gift to a friend in Los Angeles is normal. An account registered in New York that ships to 7 addresses across 4 states while logging in from 3 countries in a single day is not. The map can also flag impossible travel, meaning activity from 2 distant locations with too little time between them for a person to cover the distance, a common sign of account takeover. Takeover remains costly: the FBI’s 2025 Internet Crime Report logged roughly 4,700 account takeover complaints with $359.7 million in reported losses.
For analysts who prefer structured data, a table view lists cases and their key signals in a sortable, filterable grid. Filtering for emails younger than 7 days, disposable phones, or addresses flagged in prior fraud surfaces high-confidence cases quickly, letting analysts clear them and spend their time on ambiguous ones. When a coordinated attack hits, reviewing related cases together, sorted by risk, is far faster than working through them individually.
How playbooks make review decisions consistent
At the bottom of each case, Trust Insights shows a case summary: a structured set of questions, each with a yes, no, or unknown status. Does the identity look established or brand-new? Are the email, phone, and address consistent? Are there red flags, such as breach exposure, disposable services, or high velocity, or green flags, such as an old email, a linked online footprint, and a stable address?
The summary maps to playbooks, the decision templates that put your fraud policy into practice. A signup playbook might approve when the email is older than 180 days, the phone isn’t VoIP, and velocity is low; decline when a disposable email less than 7 days old shows very high velocity; and send everything else to review. The case summary shows which rules a case meets, so every analyst applies the same logic instead of personal judgment.
Playbooks also teach new analysts the reasoning behind decisions, and give experienced ones a checklist that frees them to focus on exceptions. When a rule starts generating false positives, you loosen it; when fraud slips past a rule, you tighten it. Consistent, explainable decisions help close the trust gap that leads teams to override their fraud models too.
Fitting Trust Insights into your existing fraud review queue
Trust Insights plugs into the tools your team already uses rather than asking analysts to abandon their case management system. A browser extension adds an analyze option next to emails and phone numbers in your CRM or fraud tool, opening Trust Insights pre-populated with that identity. For programmatic integration, your queue can generate deep links that open Trust Insights with a case’s identity data already loaded. Analysts click through from the case, review, and return to execute the decision in their primary tool.
That matches how Pipl Trust is built: it layers into the fraud platforms enterprise teams already run, and Trust pricing covers all 4 Trust products (Trust Device, Trust API, Trust Insights, and Trust Monitoring) per transaction scored. Teams running fraud investigations get the same identity context without another system to learn.
Two cases from the review queue
Case 1: A high-value purchase
The connection graph is consistent end to end. The email has existed for 8 years and pairs with 1 name, the phone is a valid mobile number, the shipping address has been the customer’s home for 5 years, and the IP is in their home city. The signal summary shows normal velocity, no breach exposure, and a long-lived online footprint. The Trust Score is 945, and the case summary matches the approval playbook. The analyst approves in about 12 seconds.
Case 2: A new signup
The email was first seen 2 days ago and has already been paired with 6 different names. The phone is a non-fixed VoIP number, the shipping address is a mail-forwarding service, and the IP resolves to Eastern Europe while the order ships to Los Angeles. The email appeared in a breach a month ago, and there’s no online footprint at all. The Trust Score is 87, and the case meets the decline playbook. The analyst declines in about 18 seconds.
Neither decision required guessing. Clear cases close in seconds, which leaves the analyst’s minutes for the cases that truly need judgment.
How do you measure manual fraud review performance?
Measure review on speed, accuracy, and volume together, since improving one at the expense of the others just moves the cost somewhere else. The core metrics:
- Average handle time: Minutes per case, from opening it to deciding.
- Manual review rate: The share of transactions routed to a human at all.
- Review-then-decline rate: The share of reviewed cases that end in a decline, which shows whether the queue is catching risk or mostly delaying good customers.
- Post-review chargeback rate: Fraud that got through after an analyst approved it.
- False decline rate: Legitimate customers turned away after review.
The biggest lever is often upstream: resolving more decisions in the scoring layer, so fewer cases reach review at all. A global consumer electronics brand cut manual reviews 27% in under 4 months with Pipl Trust, alongside a 3 basis point drop in chargebacks. A global marketplace brought manual reviews from 9% to 3.5% with Pipl Trust while lifting approvals 19.4 percentage points at the same fraud threshold.
Trust Insights works on the cases that remain, giving each one the full identity picture so the human decision is faster and more consistent.
Request a demo to see Trust Insights on your own review queue.
Frequently asked questions about manual fraud review
Is manual fraud review still necessary with AI fraud models?
Yes, for the cases a model can’t resolve with confidence. Models handle clear approvals and clear declines at scale, while analysts handle the gray zone, novel attack patterns, and high-value edge cases. The goal is a smaller, better-equipped review queue, not zero review.
How long should a manual fraud review take?
It depends on the case. Clear-cut cases should close in well under a minute when the analyst can see identity connections at a glance, while ambiguous ones deserve several minutes of real analysis. If most of your handle time goes to gathering information rather than weighing it, your tooling is the bottleneck.
What are the warning signs of a fake identity?
Common red flags include a recently created email paired with many names, a disposable or VoIP phone, a mail-forwarding address, a proxy or datacenter IP, and mismatches between billing, shipping, and IP locations. The strongest signal is usually the absence of history: real people have years of connected footprint, and fabricated identities don’t.
How can you reduce manual review volume?
Start by improving the scores that feed the queue, so fewer legitimate customers and obvious fraudsters land there. Calibrating your model to your own fraud environment, adding identity signals your rules don’t see, and tuning thresholds against real outcomes all shrink the queue. Then give analysts tools that make the remaining reviews faster.
What is the difference between manual fraud review and fraud investigation?
Manual fraud review is a near-real-time decision on a single flagged transaction or signup, usually made in minutes. A fraud investigation is a deeper inquiry, often across many accounts, to understand a scheme, recover losses, or support a case. Both depend on the same identity context.
Manual review will always cost something, though it doesn’t have to be slow or inconsistent. When analysts can see how an identity connects, why it scored the way it did, and which policy applies, clear cases close in seconds and judgment goes where it’s needed.