

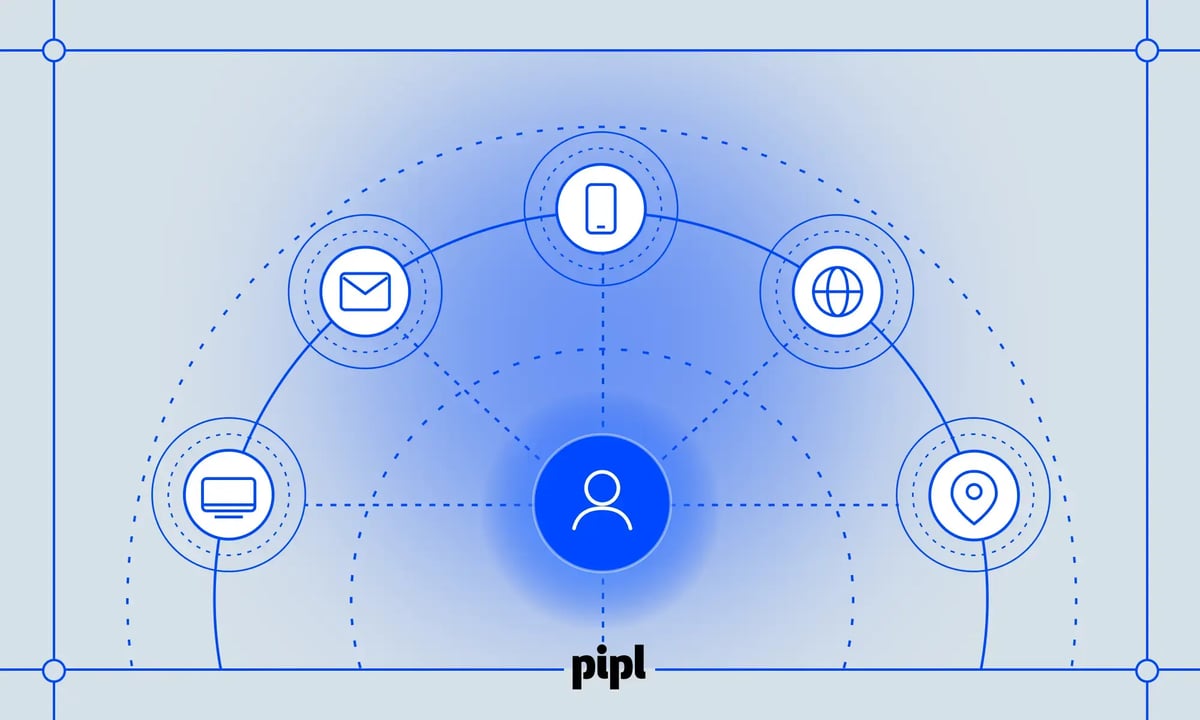


Most risk systems see an identity as a single row: one email, one phone, one address, each scored on its own merits. That view is cheap to fool. A fraudster only needs every field to be valid, and valid fields are easy to buy, borrow, or invent. What’s far harder to fake is how those fields relate to each other and to everyone else. Has this phone belonged to this name for years, or for weeks? Does this address already link to accounts under a string of unrelated names? An identity graph is built to answer those questions, and it’s the data foundation behind Elephant, Pipl’s large risk model (LRM).
What is an identity graph?
An identity graph is a data structure that stores identity attributes (names, addresses, phone numbers, emails, devices, employers) as connected points, and the relationships between them as links. Instead of a flat list of records, it shows how people, identifiers, and behaviors relate, which lets risk teams evaluate an identity in the context of everyone it touches.
Nodes, links, and clusters: reading the graph like a map
Think of the graph as a map of people. Instead of geographic features, it shows identity features: names, addresses, employment, education, and social connections. Instead of roads, it shows linkages: shared addresses, shared phones, shared devices. Instead of cities, it shows identity clusters, which are networks of related people.
Like a map, the graph becomes more valuable at scale. A single street in isolation tells you little. A complete map enables navigation, reveals patterns, and shows relationships. Pipl’s graph of 5B+ identities across 150+ countries isn’t just larger than a smaller dataset; it behaves differently, because patterns emerge at scale that stay invisible in a sample.
How is an identity graph built?
The graph is built in 3 stages: acquiring data from many sources, resolving fragments that describe the same person into one identity, and maintaining that identity as the world changes. Each stage depends on the one before it.
Stage 1: Data acquisition from thousands of sources
Every source holds only a fragment of a person. A property record shows an address and ownership. A business registry shows a company role. A news archive mentions someone’s involvement in an organization. Public records, licensed data providers, and publicly available web sources each add a piece. These fragments must be collected, validated, and consolidated before they’re useful for any risk decision.
Stage 2: Identity resolution
Identity resolution is the process of recognizing that different records describe the same person. John Smith in one public record, J. Smith in a business registry, and Jon Smith on a professional profile may be one individual, or 3. With billions of records and countless name variations, deciding which is which is computationally hard, and getting it wrong in either direction distorts every downstream score.
Deterministic vs. probabilistic matching
Deterministic matching links records through exact, confirmed identifiers, such as the same verified email on both records. Probabilistic matching weighs partial evidence (similar names, overlapping address history, a shared employer) and estimates how likely it is that two records are the same person. A graph at Pipl’s scale needs both: deterministic links for certainty, and probabilistic models that learn from large volumes of confirmed matches to resolve the cases exact matching can’t.
Stage 3: Continuous maintenance
Identities change. People move, change jobs, and open new accounts. The graph isn’t built once; it’s maintained constantly, with new sources added and existing sources sending incremental updates. Pipl’s graph is refreshed by 2B signal updates every day, which keeps a person’s resolved identity aligned with their current life rather than a snapshot from years ago.
What’s inside Pipl’s identity graph?
Pipl’s graph combines breadth (5B+ identities in 150+ countries) with depth per record and weighted connections between records. Breadth tells you whether an identity exists in the wider world. Depth and connections tell you whether it behaves like a real person.
Records rich enough to reason about
Each identity record can carry current and historical names, addresses with date ranges, phone numbers, email addresses, employment and education history, online profiles, network connections, and breach exposure. The richness per record is what makes sophisticated evaluation possible. A record with 10 years of consistent history reads very differently from one that appeared last month with no past at all.
Connections weighted by type and strength
The graph holds billions of identity connections: shared addresses linking people who live together, shared phones linking family members, shared devices linking accounts, and shared employers linking colleagues. These connections aren’t treated equally. A long-term shared address, like a married couple living together for 10 years, carries different weight than a temporary one, like a roommate for 6 months.
How fresh is identity graph data?
Freshness varies by source, and that variation is useful. Real-time signals show what’s happening now, while slower-moving records provide the historical depth that’s hard for a fraudster to fake. Typical update rhythms look like this:
- Real time: email validation and many online profile changes
- Daily: phone carrier data
- Weekly: property records
- Monthly: court filings and other public records
The system ingests these updates and propagates them through the graph. A person who moves and updates their address in one source soon appears as address-changed across the graph. Layering fast and slow signals is what lets a score reflect both the moment and the past behind it.
Global coverage: where the graph is dense and where it isn’t
Coverage isn’t uniform worldwide, and it shouldn’t be presented as if it were. The graph reflects how much reliable data each region makes available, the rules that govern it, and the languages it’s written in.
Regional variation in data density
US data is the densest, thanks to a strong public-records infrastructure and widespread digital adoption. European data is strong but tightly regulated. Coverage across Asia varies by country, with Japan and South Korea well covered and parts of Southeast Asia sparser. African coverage is still developing. This variation is a reality of data availability, not a product limitation.
Privacy regulation by jurisdiction
Privacy law shapes what can be collected and how long it can be kept. In Europe, the General Data Protection Regulation (GDPR) sets the rules for processing personal data. In California, the California Consumer Privacy Act governs how businesses collect and use personal information, with enforcement and guidance from the California Privacy Protection Agency. The graph handles this by sourcing legally available data and respecting each jurisdiction’s restrictions, so data sourced in Europe is handled to European standards and California data to California law.
Names and addresses in hundreds of languages
Names, addresses, and records appear in hundreds of languages and character sets. A Chinese name may be transliterated several ways, and an address in Arabic script may have multiple romanizations. Matching models have to treat these as the same identity when they are, and as different identities when they aren’t. That multilingual capability is what makes true global coverage possible.
How does confidence scoring work in an identity graph?
Confidence scoring assigns each data point a measure of how much it can be trusted, based on where it came from and how well it holds up. With billions of records from many sources, quality varies widely: a property deed is high confidence, while an anonymous forum profile is low confidence.
The 4 signals behind a confidence score
- Source credibility: official records score higher than self-reported or user-generated data.
- Corroboration: information confirmed by multiple independent sources scores higher than single-source information.
- Recency: fresh data scores higher than stale data.
- Consistency: information that agrees across multiple instances scores higher than conflicting data.
Putting confidence scores to work
Confidence scores decide how much weight each signal carries. High-confidence data can support important decisions on its own. Medium-confidence data can prompt further checks, and low-confidence data needs corroboration before it influences anything. Pipl Trust API scoring uses confidence-weighted signals, so high-confidence signals have a stronger influence on each Trust Score, and every score comes with the signals and reason codes behind it.
Why does identity graph scale improve fraud detection?
Scale improves fraud detection because many fraud patterns are only visible across many identities at once. A single record can look legitimate, while the same record viewed alongside millions of others can reveal itself as one node in a coordinated network.
Patterns that only appear at scale
At small scale, the graph might show that John Smith lived at address A in 2020, address B in 2021, and address C in 2022. That’s useful personal history. At global scale, you can compare John’s movement against millions of other people. Are those moves frequent or unusual? Do they trend toward one region? When combined with employment data, you may find his moves line up with job changes. That kind of ordinary, explainable pattern helps a legitimate customer get approved instead of declined.
How a graph exposes a fraud ring
The same principle works in reverse for fraud. A single fabricated identity can pass individual checks. Now picture 50 identities created from the same device, with names that follow the same generator pattern, emails from the same provider, and the same address appearing across different accounts. Viewed one transaction at a time, each looks plausible. Viewed as a graph, the ring is obvious. This is the same mechanism behind synthetic identity fraud detection using digital history: a fabricated person can fake attributes, but not years of consistent connections. The Federal Reserve has published an industry-recommended definition of synthetic identity fraud that helps teams classify these cases consistently.
Warning signs a graph can surface
- Many accounts linked to 1 device or 1 address in a short period
- Names, emails, or usernames that follow a generated pattern
- Identities with current attributes but no historical depth
- Clusters of new identities that share several connections at once
- A new device or address that links back to a known fraud ring
Aggregated insights across the Trust Network
Graph intelligence also compounds across customers. Pipl Trust customers form the Trust Network, whose aggregated insights (never raw customer data) feed Elephant’s calibration. A fraud pattern that surfaces in one vertical or geography can then inform scoring elsewhere, while Elephant is retrained continuously to reflect the specific fraud patterns of each customer’s environment.
What infrastructure does a real-time identity graph need?
Real-time graph intelligence needs two things working together: ingestion pipelines that absorb constant updates, and a query layer fast enough to sit inside a live decision.
Ingestion around the clock
Data ingestion pipelines continuously pull from many sources, validate quality, integrate new information, and update the graph 24/7. They must handle spikes, such as a large provider releasing a bulk update, while keeping throughput steady. The architecture is designed for both volume and latency.
Queries fast enough for checkout
A lookup on an email address has to search billions of records and return an answer fast enough to sit inside an authorization flow. That takes indexing and caching across the entire graph, distributed infrastructure, and optimized query execution. Elephant assesses transaction risk in milliseconds, which is what lets graph intelligence run at the point of decision rather than after the fact. Large-scale graph work like this is an established engineering approach; for example, AWS documents how one ride-hailing platform used graph-based deep learning to detect identity fraud.
How graph scale powers Pipl products
Every Pipl product draws on the same graph, and each one turns its scale into a different kind of decision support. None of them replaces a customer’s risk engine; they plug into existing models, rules, and workflows.
Trust API: scores built on graph depth
Trust API accuracy improves with graph scale. More data means more signals for each identity, and more identities mean more patterns visible in the data. Elephant, the model behind Trust, was trained on more than 1 trillion payment fraud signals across connections between 5B+ identities, rather than on a single company’s history.
Trust Insights: investigation that shows the network
Trust Insights gets its investigative value from the same graph. Its connection view of related identities matters because the graph links 5B+ records. With a small graph, most lookups would return isolated individuals; with the full graph, they reveal networks, showing fraud rings and connected patterns. For a closer look at the analyst experience, see how Trust Insights supports manual fraud review.
Pipl Search: one identity from many fragments
Pipl Search applies Elephant’s identity resolution to the global graph, so investigators can resolve a subject to a single identity and map the connections around them. That’s the core of fraud investigations at scale: seeing the whole network, not just the individual.
See what your risk engine is missing. Request a demo to test Pipl Trust against your own data.